05. July 2019
TidyTuesday – Media Franchises
I finally accomplished the Data Science in R track on Datacamp, which means, I have more time to do and blog about data analytics and data science. For a start, I chose to participate in the latest Tidytuesday, with a small explorative data analysis. This weeks topic is all about media franchise powerhouses. So lets dive in and take a look at the data set.
|
|
As usual in tidy Tuesdays, a big focus lays on the tidyverse, so I’ll load that package before doing anything else.
|
|
A glimpse into the data shows a little more, than a handful of features and 321 observations. In this rather small data set, every observation represents an unique combination of a franchise and its category, let it be book sales or cinema box office revenues. As Disney is currently on a big shopping stroll across the industry, I want to examine their position in the market and check out the diversity of their revenue stream across franchises.
Disney, the biggest player
I already spotted a minor problem of the data. The franchise owner are mostly separated into sub-companies, so that for example Marvel and Star Wars are different entities, but basically belong to Walt Disney. The same goes for Sony or other media houses, like AT&T. I identified some of the biggest players and summarise them, based on their mother company.
Before, creating an overview of the biggest motherships in the media industry, I want to check, whether some of the bigger ones are cooperating on franchises. For this, I assign dummy variables for each company and add them together. Every franchise, which is a cooperation should then have a value of two and can easily be filtered.
|
|
We can see, only the spider-man movies are made in a cooperation between Disney and Sony. It shouldn’t have a big impact, based on revenue, but nevertheless, I will exclude this franchise and give it an unique name. Below, you can see an overview of the cooperative spider-man franchise, right from the original data.
| name_of_franchise | revenue_category | revenue | year_created | original_media | creators | The_current_owners_of_the_source_materials_rights | cooperation |
|---|---|---|---|---|---|---|---|
| Marvel Cinematic Universe | Box Office | 21.000 | 2008 | Film | Marvel Studios | Walt Disney Studios (The Walt Disney Company) (franchise) Sony (Spider-Man films) | 2 |
| Marvel Cinematic Universe | Home Video/Entertainment | 5.000 | 2008 | Film | Marvel Studios | Walt Disney Studios (The Walt Disney Company) (franchise) Sony (Spider-Man films) | 2 |
| Marvel Cinematic Universe | Merchandise, Licensing & Retail | 5.000 | 2008 | Film | Marvel Studios | Walt Disney Studios (The Walt Disney Company) (franchise) Sony (Spider-Man films) | 2 |
| Spider-Man | Box Office | 6.000 | 1962 | Comic book | Stan Lee Steve Ditko | Marvel Entertainment (The Walt Disney Company) (franchise) Sony (films) | 2 |
| Spider-Man | Comic or Manga | 1.000 | 1962 | Comic book | Stan Lee Steve Ditko | Marvel Entertainment (The Walt Disney Company) (franchise) Sony (films) | 2 |
| Spider-Man | Home Video/Entertainment | 1.150 | 1962 | Comic book | Stan Lee Steve Ditko | Marvel Entertainment (The Walt Disney Company) (franchise) Sony (films) | 2 |
| Spider-Man | Merchandise, Licensing & Retail | 14.000 | 1962 | Comic book | Stan Lee Steve Ditko | Marvel Entertainment (The Walt Disney Company) (franchise) Sony (films) | 2 |
| Spider-Man | Music | 0.212 | 1962 | Comic book | Stan Lee Steve Ditko | Marvel Entertainment (The Walt Disney Company) (franchise) Sony (films) | 2 |
| Spider-Man | TV | 0.880 | 1962 | Comic book | Stan Lee Steve Ditko | Marvel Entertainment (The Walt Disney Company) (franchise) Sony (films) | 2 |
| Spider-Man | Video Games/Games | 1.308 | 1962 | Comic book | Stan Lee Steve Ditko | Marvel Entertainment (The Walt Disney Company) (franchise) Sony (films) | 2 |
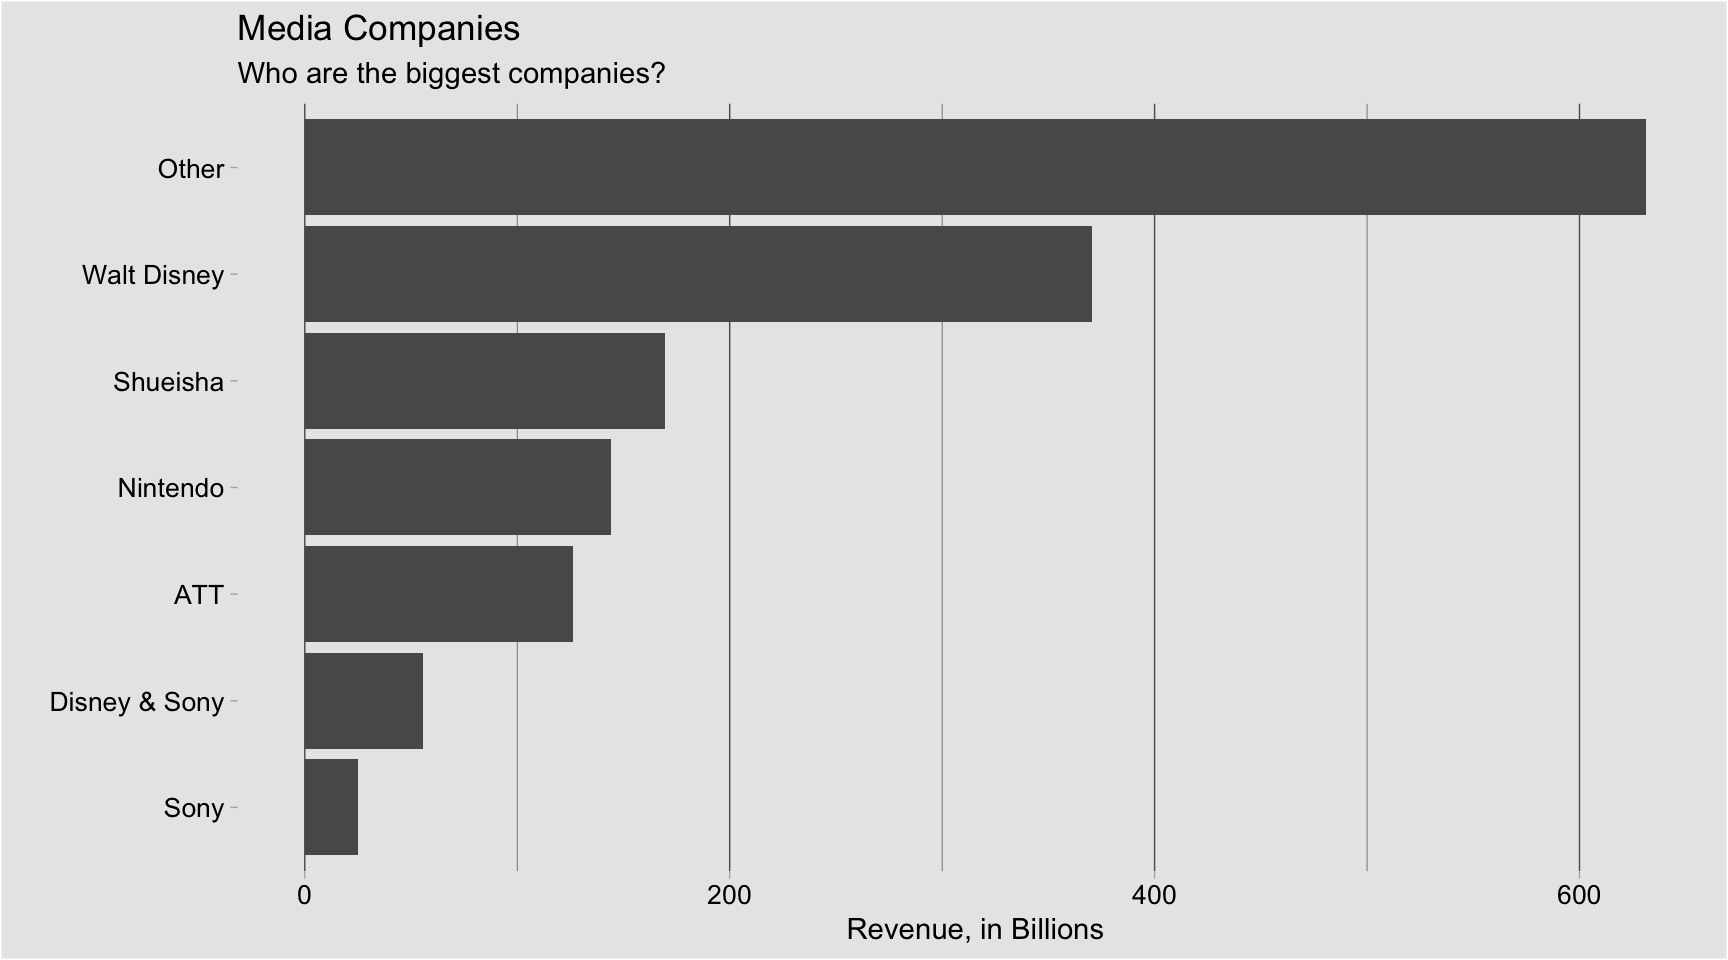
Is Disney the biggest player in the market?
The plot below shows, Disney leads with no real competition. But this chart doesn’t recognizes the current state, but summarises all franchises, across all past years. Including the development over time, would be very interesting, but is nothing the data can provide.
|
|
Disneys revenue diversity
Now, my big question is, how well the revenue stream is diversified or maybe how much Disney depended on one type income. Therefore I want to depict every franchise, its revenue and where the money comes from. But first things first. I structured the revenue categories in three main groups and colored them to provide a better overview. Regarding the coloring, I got inspired by the great SMYCK Color Scheme from John Paul Bader, aka Hukl. I plan to transfer these colors into a full fledged theme.
- Everything motions picture (Cinema, Home Video, TV) – Red
- Secondary revenue (Merch, Music, Video Games) – Green
- Written (Books, Comics/Manga) – Yellow
|
|
Finally, I can group by franchise and compare the Revenue Money.
|
|
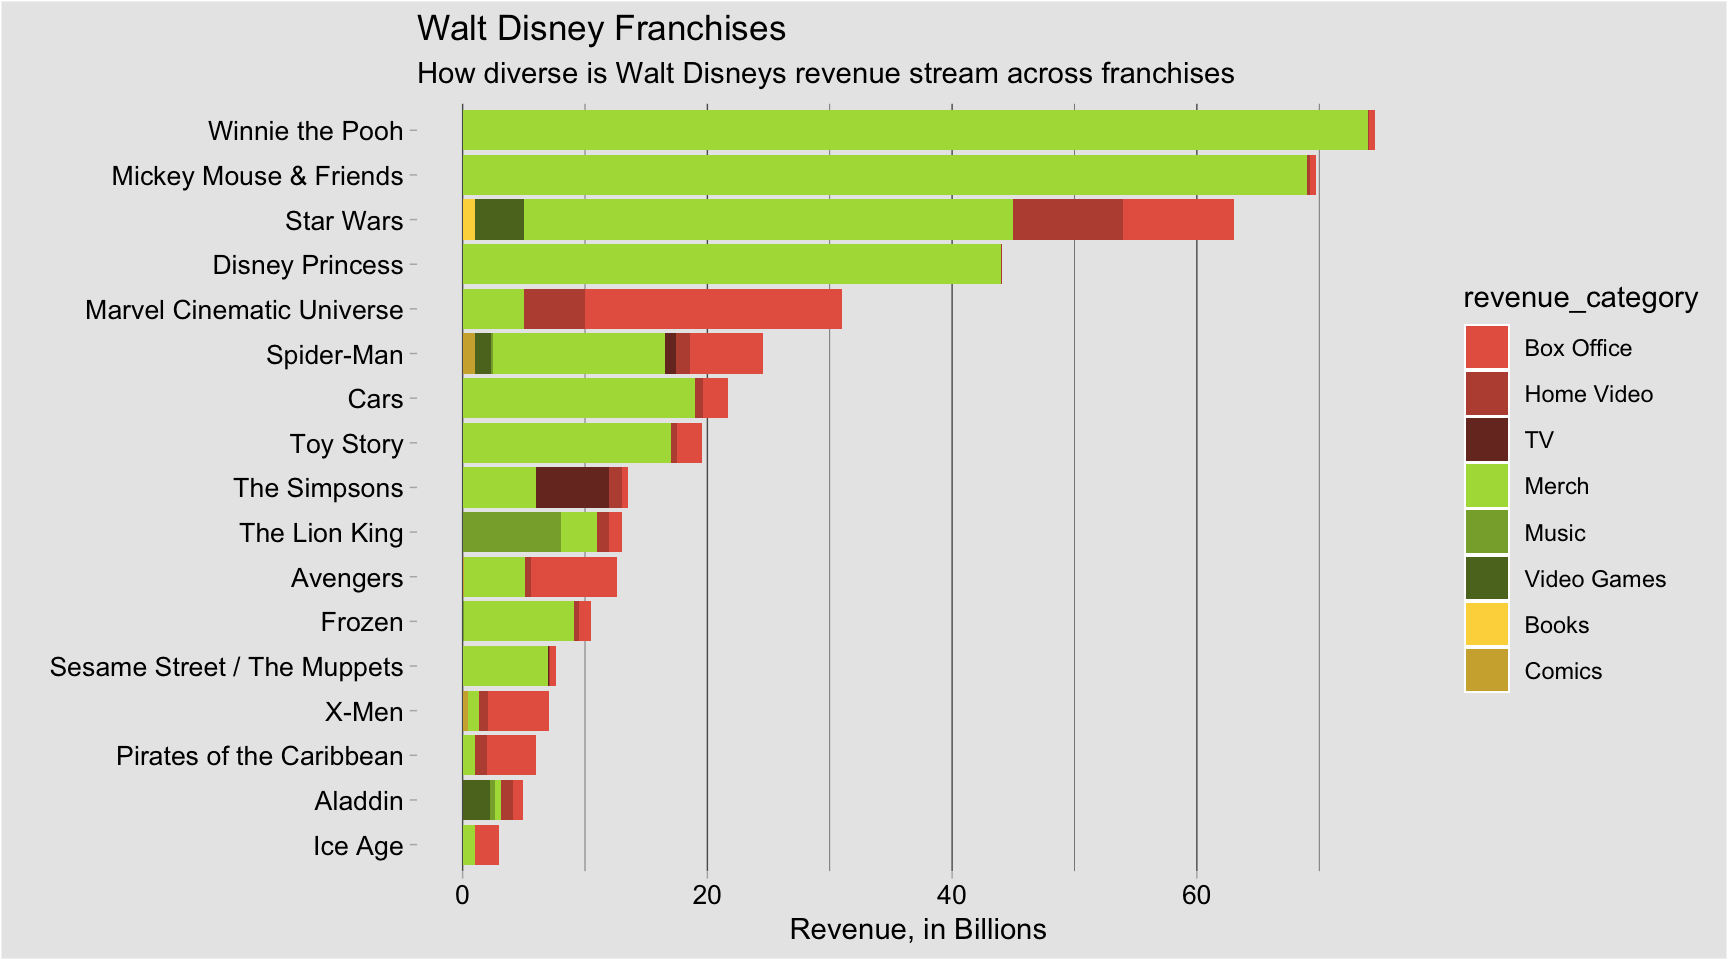
Based on this chart it becomes obvious, Disney is mostly a toy company. The largest part of revenue from their biggest franchise was generated by Merch, aka Toys and T-Shirts. Some things are notably, nevertheless. Revenue from Marvel franchises is mainly generated by motion picture based sells.
I think the biggest problem with this data is its time independence. Hugh revenue contributors such as Star Wars already generated a lot of money, before they joined the Disney Family. Same goes for the X-Men which until recently belonged to Fox. I believe, when looking a the diversity across time, we would see a constant importance shift from Merch to Movies. This data sadly only shows the sum of all revenue ever created.
Thanks for reading!