SDG Hackathon

What is the SDG-Hackathon

SDG is short for Sustainable Development Goals. These goals, defined by the UN, describe priority topics humanity should focus on, in order to promote global development for all. CorrelAid Switzerland and University of Basel organized a very interesting hackathon last weekend. Their target was to visualise research behavior with regards to these goals. Besides great talks from Valentina D’Efilippo and Cedric Scherer there was a contest for the best visualisation. Therefore they created dataset which contains projects, funded with help of the Swiss National Science Foundation. Projects with such funding need to be openly accessible, which offers the possibility to search for and tag SDG goals in every project.

My take on it

Sadly I didn’t have enough time that weekend to submit a contribution to the competition. So I took a quick look at the dataset on the weekend and made a little submission the day after the deadline. I had no previous idea about these goals, so I couldn’t really grasp what SDG-1, or SDG-2 really meant. There are 17 goals and my initial intention was to look out for goals and how much each one discussed in Projects. As I assumed, that each goals should be differently discussed by each discipline. I decided to use predefined Discipline labels as a second indicator for my visualisation. Of course, for a deeper analysis you should also check, how different labeling systems consider goals, how different goals are considered if different institution from other countries are involved or a lot of other biases. But this should be kept simple for now.

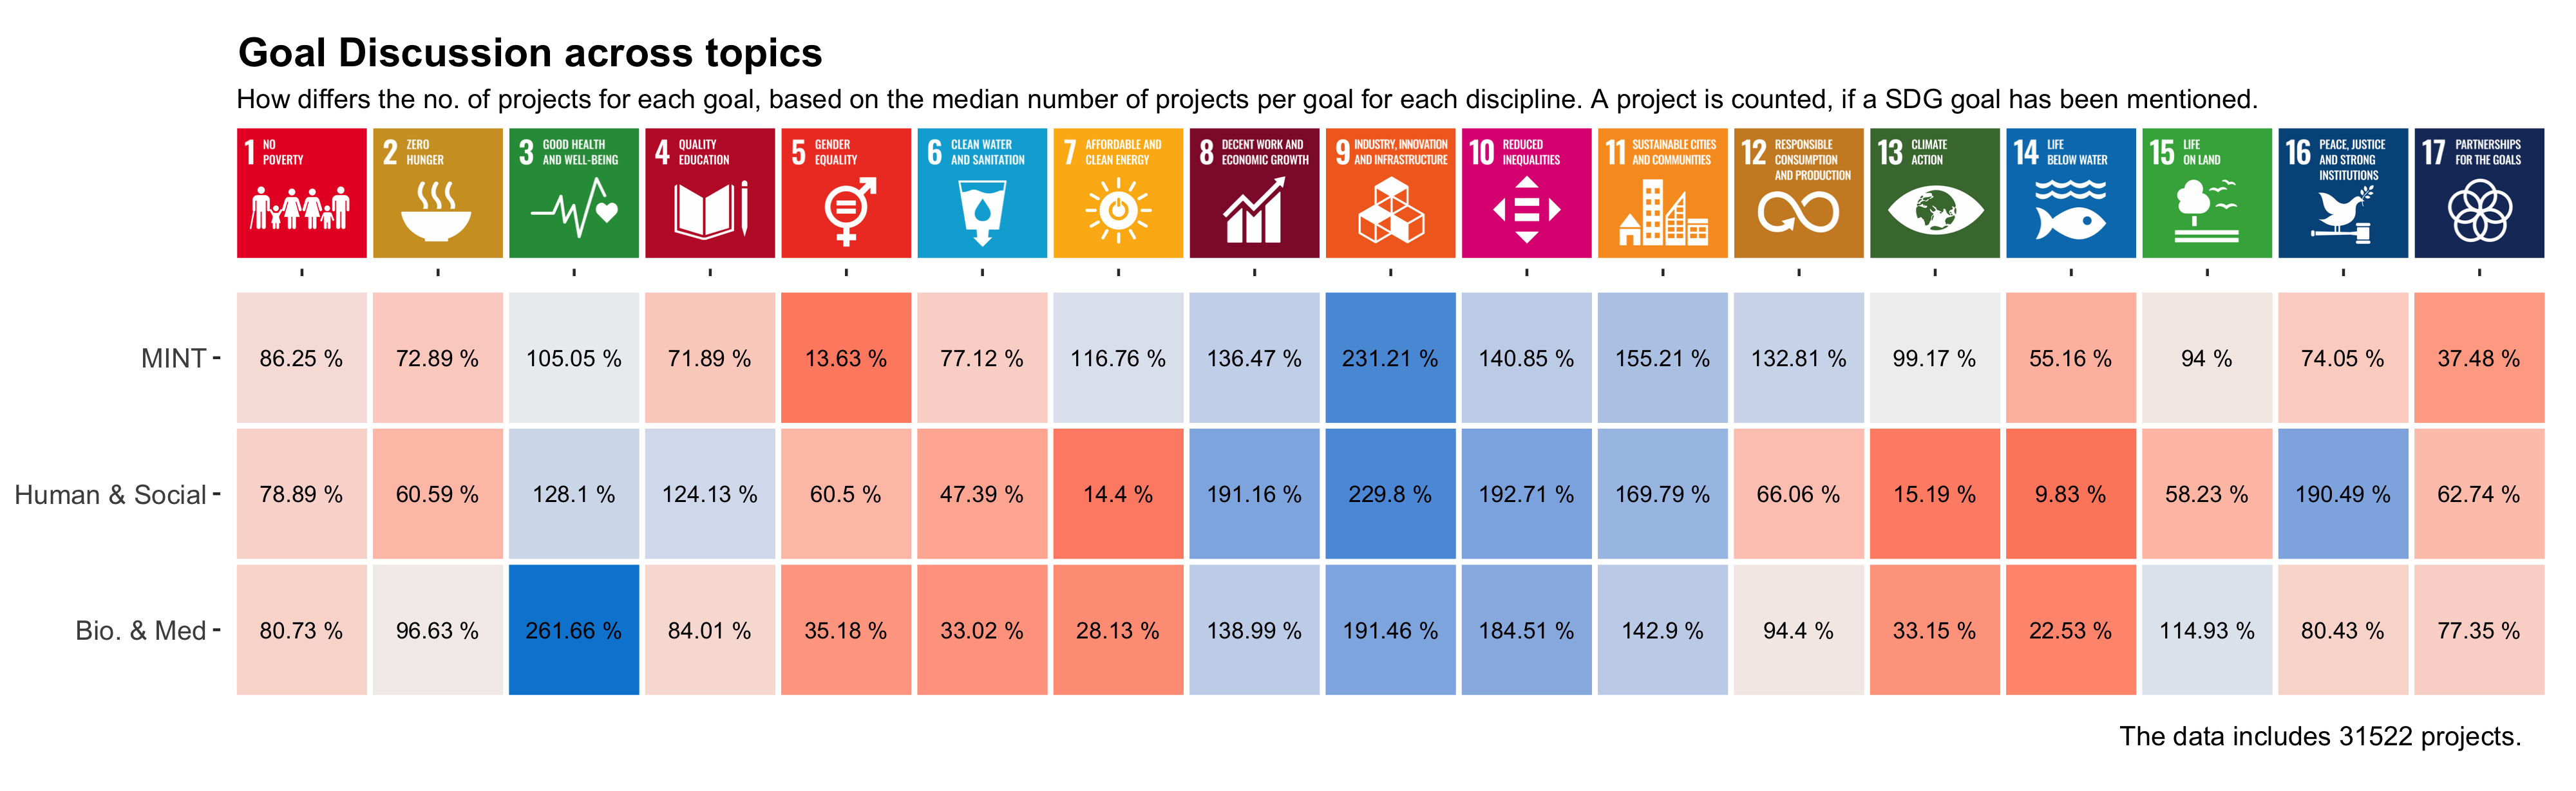
The dataset from github contains information about disciplines in a variety of hierarchies. I wanted to focus on the one at the top, that consists of “Biology and Medicine”, “Humanities and Social Sciences” and Mathematics, Natural- and Engineering Sciences" for which I simply used the short form Bio. & Med, Human & Social and MINT. In a different analysis it would be fun to categorize the most detailed discipline information based on SDG search hits. For now, I calculated the median value, of how many projects discuss a specific goal for each Discipline. Afterwards, I looked at how much each topic differs from that median value. This makes for a quick overview at how goals are discussed between disciplines.

See a preview below or a full sized image here.

You can check out the code below.

 1
 2
 3
 4
 5
 6
 7
 8
 9
10
11
12
13
14
15
16
17
18
19
20
21
22
23
24
25
26
27
28
29
30
31
32
33
34
35
36
37
38
39
40
41
42
43
44
45
46
47
48
49
50
51
52
53
54
55
56
57
58
59
60
61
62
63
64
65
66
67
68
69
70
71
72
73
74
75
ibrary(tidyverse)
library(ggtext)
setwd("~/Projects/SDH-Hackathon/sdghackathon")


sdg_hackathon_data <- read_csv("~sdg_hackathon_data.csv") 
supplementary_data <- read_csv("~supplementary_data.csv")


combined_data <- left_join(sdg_hackathon_data, supplementary_data) #%>% 
#filter(institution_country == "Switzerland") %>% 

Parameter <- tibble(picture_width_px = 48.5, 
                    tile_text_size = 3, 
                    axis.text.y = 10)

pic_list <- tibble(directory = dir("SDG Icons 2019/"), 
                   goal = sort(unique(combined_data$sdg))) %>% 
  mutate(goal_path = paste("<img src='https://www.georg-olm.eu/sdg/", .$directory, "',
                             width = '",Parameter$picture_width_px,"'></img>", sep = ""))

y_label <- tibble(name = c("Biology and Medicine",
                           "Humanities and Social Sciences", 
                           "Mathematics, Natural- and Engineering Sciences"), 
                  y_label = c("Bio. & Med", 
                              "Human & Social", 
                              "MINT"))


filtered_data <- combined_data %>% 
  separate(discipline_name_hierarchy, c("Discipline", "Sub-Discipline"),
           sep = ";") %>% 
  filter(!is.na(Discipline), 
         !is.na(sdg)) 

plot_data <- filtered_data %>% 
  distinct(project_number, sdg, Discipline) %>% 
  group_by(sdg, Discipline) %>% 
  summarise(no_project = n()) %>% 
  group_by(Discipline) %>% 
  mutate(mean_project_perDiscipline = mean(no_project), 
         perc_difference = round(no_project/mean_project_perDiscipline * 100,
                                 digits = 2)) %>% 
  left_join(y_label, by= c("Discipline"="name"))
  

t = deframe(pic_list[,c(2,3)]) # creating a named vector from to tibble columns

plot <- ggplot(plot_data, aes(x = sdg, y = y_label, fill = perc_difference,
                              label = paste(perc_difference, "%")))+
      geom_tile(colour = "white", size = 1)+
      scale_fill_gradient2(low = "#eb0000", mid = "#f1f1f1",
                            high = "#0088d7", midpoint = 100)+
      geom_text(size = Parameter$tile_text_size) +
      scale_x_discrete(name = NULL, labels = t, position = "top") +
      coord_equal()+
      labs(title = "Goal Discussion across topics", 
           subtitle = "How differs the no. of projects for each goal, based on the
                       median number of projects per goal for each discipline. 
                       A project is counted, if a SDG goal has been mentioned.", 
           caption = paste("The data includes",
                            length(unique(filtered_data$project_number)),
                            "projects.", sep=" "))+
      theme(axis.text.y = element_text(size = Parameter$axis.text.y), 
            panel.background = element_blank(),
            panel.grid = element_blank(), 
            axis.text.x.top = ggtext::element_markdown(),
            axis.title.y = element_blank(),
            legend.position="none", 
            plot.title = element_text(face = "bold", size = 15, hjust = 0.01), 
            plot.subtitle = element_text(size = 10, hjust = 0.052),
            plot.caption = element_text(size = 10, hjust = 0.98))

ggsave("plot_2.png", plot, device = "png", width = 4000, height = 1800, units = "px")
The LatestT